
How To Measure and Compare Investments
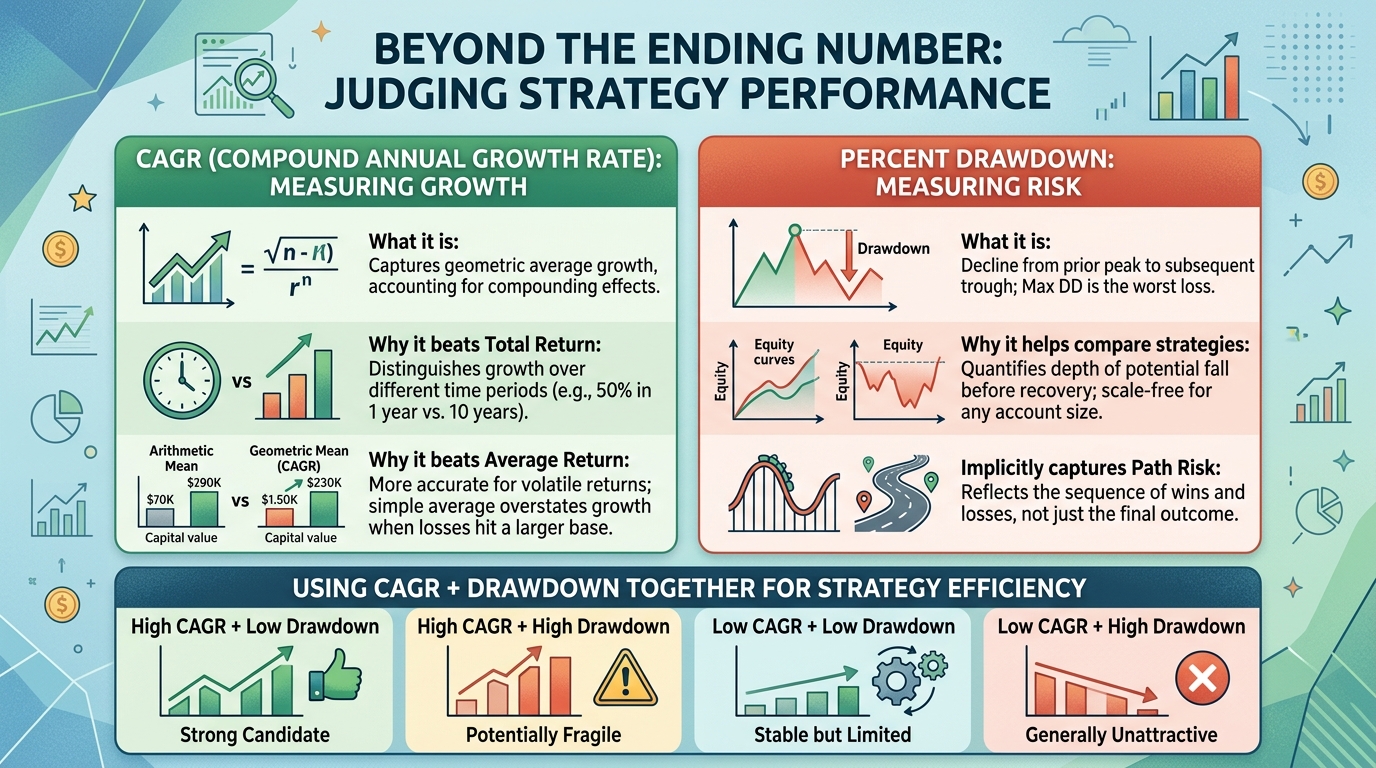
Strategy performance isn’t just “how much did it make?”—it’s “how fast did it grow?” and “how painful was the ride?” Two metrics that answer those questions well are CAGR and Percent Drawdown.
Why performance measurement matters
A strategy’s equity curve can look impressive while hiding unstable growth, long recovery times, or tail-risk exposure. Metrics help you compress a long return history into comparable numbers so you can make decisions across different strategies, markets, and time windows.
CAGR: the growth rate that “counts” compounding
CAGR (Compound Annual Growth Rate) is the constant annual rate that would take your starting equity to your ending equity over the full period, accounting for compounding. In other words, it captures the combined effect of all positive and negative returns across many periods because losses reduce the base you compound on going forward.
Why CAGR beats total cumulative return
Total cumulative return tells you “ending vs. beginning,” but it ignores time. A 50% total return achieved in 1 year is very different from 50% achieved over 10 years, and CAGR correctly distinguishes those by converting results into an annualized growth rate.
This is why CAGR is superior for cross-strategy comparisons span different lengths of time.
Why CAGR beats average return
A simple average of periodic returns (arithmetic mean) can mislead because it doesn’t reflect compounding and is distorted by volatility. For example, +50% then −50% averages to 0% per period, but your capital ends at 75% of where it started (because the loss hits a larger base), which CAGR reflects while the arithmetic average masks.
In practice: the more volatile the return path, the more “average return” can overstate real wealth growth.
Percent drawdown: a practical risk yardstick
Drawdown measures the decline from a prior equity peak to a subsequent trough, expressed as a percentage of that peak. The most commonly used version is Maximum Drawdown (Max DD): the worst peak-to-trough loss over the period.
This matters because it quantifies a risk dimension that returns alone can’t: how deep the strategy can fall before recovering (or failing).
Why drawdown helps compare strategies
Two strategies can have similar returns but very different drawdowns; the one with smaller drawdowns is often easier to stick with and can allow larger position sizing without blowing up risk limits. Percent drawdown also makes strategies more comparable across account sizes because it’s scale-free (a 20% drawdown is a 20% drawdown, whether you trade $10k or $10M).
Drawdown also implicitly captures “path risk”—the sequence of wins and losses—not just the final outcome.
Using CAGR + drawdown to judge quality
Together, CAGR and percent drawdown give a fast read on efficiency: how much growth you got per unit of pain. A useful way to think about it is:
High CAGR + low drawdown: strong candidate (efficient compounding with controlled risk).
High CAGR + high drawdown: potentially fragile; may require strict sizing, hedging, or risk constraints.
Low CAGR + low drawdown: stable but may not justify complexity/opportunity cost.
Low CAGR + high drawdown: generally unattractive; risk isn’t being paid for.